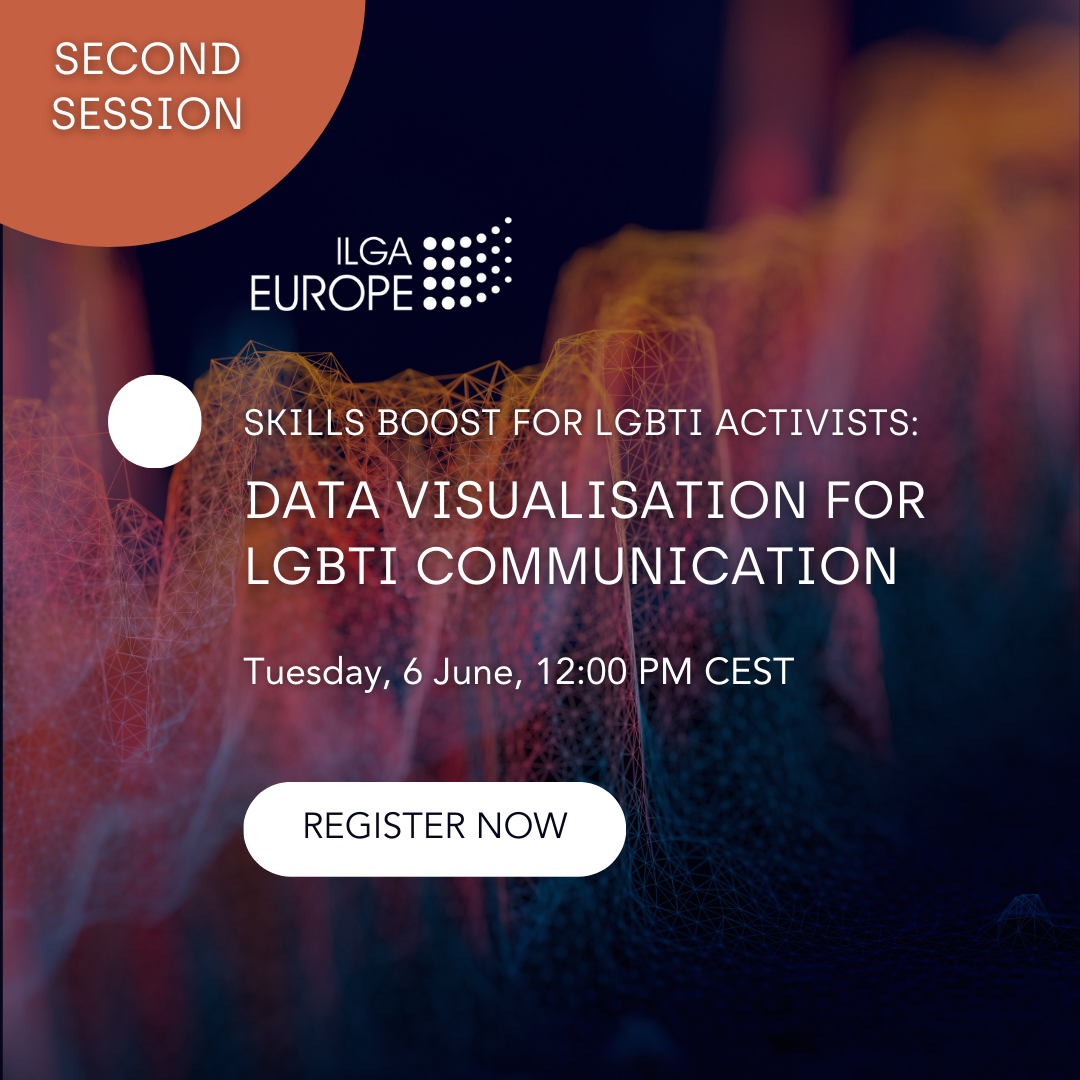
Skills Boost: Data visualisation for LGBTI communication
Do you wish you could visualise data to tell better stories for your LGBTI activism? Have you wanted to use an infographic but are not confident in your data or design skills? Join our next Skills Boost about data visualisation for LGBTI communication.

First session
This will be a beginner-friendly 60-minute session focusing on creating simple graphics using data from the freshly launched ILGA-Europe 2023 Rainbow Map and Index. You will:
- Get inspiration from other data visualisations and designers on LGBTI issues
- Be introduced to the new 2023 Rainbow Map & Index and how to find a story relevant to your work among the data
- Receive templates and a step-by-step demonstration of how to create a graphic using the free design tool Canva.
- Have a chance to submit your own draft graphic and get personalised feedback at a follow-up session
Join our next Skills Boost about data visualisation for LGBTI communication on Thursday 25 May, 12 noon CEST by registering here.
second session
At the second session on data visualisation, you can receive individual feedback to every exercise sent to sho@ilga-europe.org before 5 June. There will be more time for questions, discussions and peer-learning, so join us even if you are not doing “homework”.
Exercise: In the end of the previous session, we asked you to create a draft data graphic for yourself and send to sho@ilga-europe.org by Monday, 5 June. Please send high-resolution original version (if you use Canva, you can send a ‘collaboration link’ so we can directly suggest edits).
Tell us in the email (very briefly):
- What story you want to tell/point you want to make with it
- If there is more you would like to improve about it with our help
- Permission for ILGA-Europe to share it on our social media channels (when it is ready)
Join the session on Tuesday 6 June, 12 noon CEST by registering here.
Did you miss this session? Find the recording and some additional materials to look at below!
You might want to check other comms resources by ILGA Europe:
- From numbers to stories: How LGBTI activists can use data visualisation (ILGA-Europe blog post): https://www.ilga-europe.org/blog/lgbti-activists-data-visualisation/
- Digital advertising for LGBTI activists: What we learned at the latest ILGA-Europe Skills Boost (ILGA-Europe blog post): https://www.ilga-europe.org/blog/digital-advertising-for-lgbti-activists-what-we-learned-at-the-latest-ilga-europe-skills-boost/
- 5 Proactive Communications Steps for Small Organisations (a Hub card): https://hub.ilga-europe.org/communications/5-proactive-communications-steps-for-small-organisations/
Do you struggle with some specific communications challenge, and do not know where to start? Reach out to us, we might be able to help! Contact svetlana@ilga-europe.org